Click here to access the link to the google drive classroom shared folder and locate the lesson to follow step-by-step instructions.
|
Google Docs
|
|
Intro to Formatting Activity
Students learn the essentials of formatting titles, body text, and images. They format text size and alignment. They also learn how to create and edit bulleted lists.
Students learn the essentials of formatting titles, body text, and images. They format text size and alignment. They also learn how to create and edit bulleted lists.
|
Creating tables intro activity
In this beginner-friendly activity, students create a table for a fitness workout schedule. Tables are an excellent way to organize and present data in a visually compelling manner. Students are exposed to many valuable and useful formatting skills including: • how to create a table • inserting rows • inserting columns • merging cells • aligning information center and right • changing the color of text • underlining text • changing the color of rows and columns |
|
Black Sports Pioneers Research Activity
In this cross-curricular research activity, students create and format a table containing facts about significant African American trailblazers in the world of sports. Students are exposed to many valuable and useful formatting skills including:
• how to create a table
• using the "table formatter" Google Docs Add-On to quickly format a table
• changing font style, face, size and color
• underlining text
• adding page numbers and footers
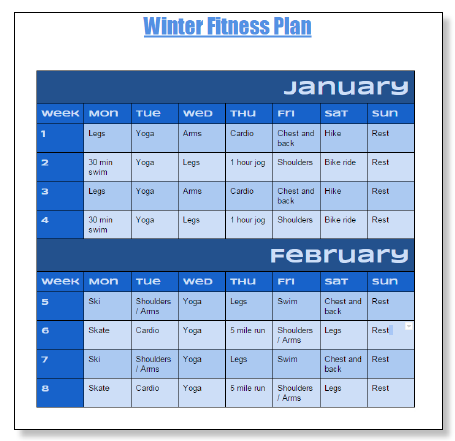
Creating a clickable, dynamic calendar
Students work in Google Docs to create an interactive, linked calendar containing images to suit each month. Students create hyperlinks to make their calendars real live documents that they can quickly and efficiently navigate. Students stylizing the calendars to suit their own tastes.
Students work in Google Docs to create an interactive, linked calendar containing images to suit each month. Students create hyperlinks to make their calendars real live documents that they can quickly and efficiently navigate. Students stylizing the calendars to suit their own tastes.
Google Sheets
Introduction to formatting
This lesson serves as a great starting place for beginners to learn how to use the spreadsheet program Google Sheets, which is basically like an online version of Excel. Specifically, students learn the essentials of entering data, formatting fonts and tables, merging columns and formatting a number rounded to the desired place value. This activity is intended as a launching pad into more Google Sheets lessons that will become increasingly challenging. This entry level assignment does not have any math, which will come in activities to follow.
This lesson serves as a great starting place for beginners to learn how to use the spreadsheet program Google Sheets, which is basically like an online version of Excel. Specifically, students learn the essentials of entering data, formatting fonts and tables, merging columns and formatting a number rounded to the desired place value. This activity is intended as a launching pad into more Google Sheets lessons that will become increasingly challenging. This entry level assignment does not have any math, which will come in activities to follow.
Basic Math using SUM and AVERAGE
In this activity, students create and format a fictional data table which displays how many days of sunshine occurred month by month for various U.S. cities. The SUM function is then used to total the number of days for each month for all cities. The Average function is used to calculate the monthly averages for the cities. A valuable shortcut called Filling Down is demonstrated so that students can click and drag to quickly reuse the functions and avoid retyping. Students also review basic formatting in Google Sheets including changing fonts, colors, etc...
In this activity, students create and format a fictional data table which displays how many days of sunshine occurred month by month for various U.S. cities. The SUM function is then used to total the number of days for each month for all cities. The Average function is used to calculate the monthly averages for the cities. A valuable shortcut called Filling Down is demonstrated so that students can click and drag to quickly reuse the functions and avoid retyping. Students also review basic formatting in Google Sheets including changing fonts, colors, etc...
|
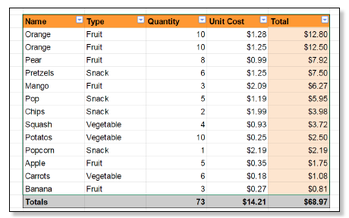
Shopping List Math Lesson
In this beginner level lesson, students create a dynamic, sortable grocery list which contains some basic math. Students learn to create custom formulas for multiplication (units x unit prices). They also use the SUM function that is built into Google Sheets to total up how much money has been spent on groceries. |
|
A valuable shortcut called "Filling Down" is demonstrated so that students can click and drag to quickly reuse the functions and avoid retyping. Students also review basic formatting in Google Sheets including changing fonts, colors, etc...As mentioned earlier, students learn to apply filters so that they can easily sort groceries according to categories (fruits, snacks or vegetables).
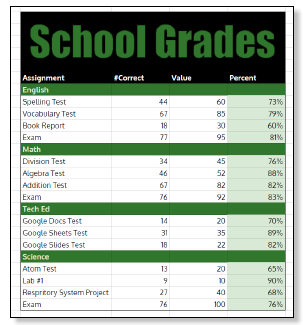
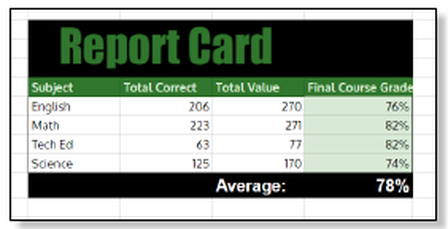
School Grades Math Lesson
Students learn how teachers figure out grades in this lesson. The math covered in this assignment is the review of the SUM and AVERAGE functions, and students are shown how to use division to calculate percentages for grades. Basic formatting is reviewed here, and the Paint Format button is introduced to demonstrate a valuable time-saving shortcut for students. Students are also asked to create a second "Report Card" tab that displays overall grades for specific subjects.
Students learn how teachers figure out grades in this lesson. The math covered in this assignment is the review of the SUM and AVERAGE functions, and students are shown how to use division to calculate percentages for grades. Basic formatting is reviewed here, and the Paint Format button is introduced to demonstrate a valuable time-saving shortcut for students. Students are also asked to create a second "Report Card" tab that displays overall grades for specific subjects.
|
|
Basketball Stats Math Activity
This is a great lesson for working on slightly more complex math in Google Sheets using some common basketball stats. Here, students enter some fictional data for an NBA team and calculate things such as Field Goal %, Free Throw %, Rebounds Per Game and Points Per Game. Students must use some order of operations and brackets to make the math work out properly.
This is a great lesson for working on slightly more complex math in Google Sheets using some common basketball stats. Here, students enter some fictional data for an NBA team and calculate things such as Field Goal %, Free Throw %, Rebounds Per Game and Points Per Game. Students must use some order of operations and brackets to make the math work out properly.
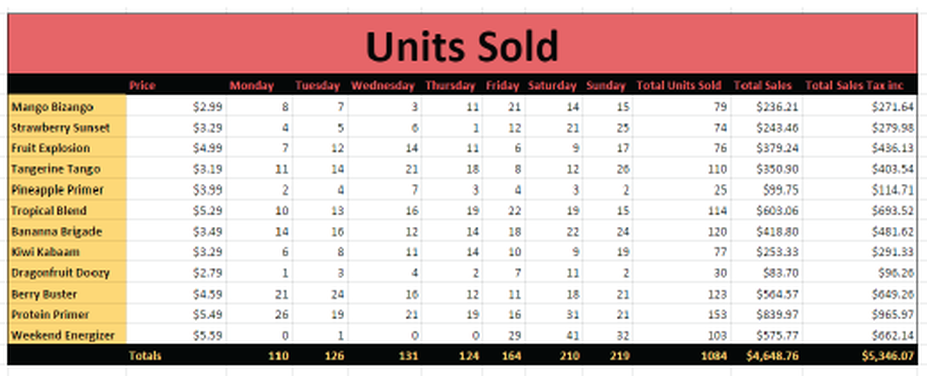
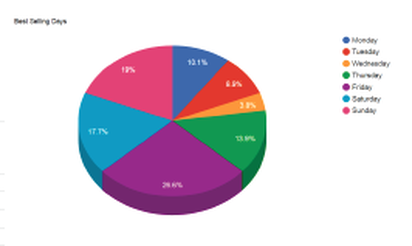
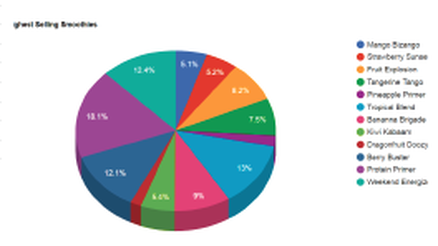
Smoothie Sales Chart Activity
A fictional Smoothie store is used here as the basis for teaching students how to create pie charts to display information visually. Students use some math functionality in Google Sheets to calculate totals units sold, sales, and total sales with a tax applied. They also review some basic formatting skills to change the appearance of a table of sales data.
A fictional Smoothie store is used here as the basis for teaching students how to create pie charts to display information visually. Students use some math functionality in Google Sheets to calculate totals units sold, sales, and total sales with a tax applied. They also review some basic formatting skills to change the appearance of a table of sales data.
|
|
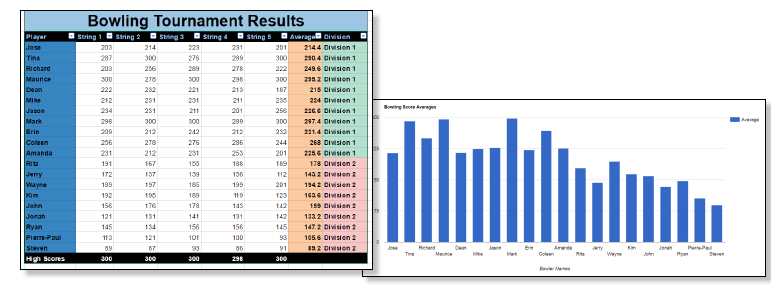
Bowling Scores Chart Review
In this engaging activity, students populate a spreadsheet with fictional data from a preseason bowling tournament. Students use the AVERAGE function to calculate the bowler's average score for 5 strings. Conditional formatting is used as students are introduced to the IF function which assigns each bowler to Division 1 or Division 2 for the upcoming season based on their scores.
The MAX function is used to determine top scores for each of the 5 strings the bowlers participated in. Additionally, students used a bar chart to reflect the data visually.
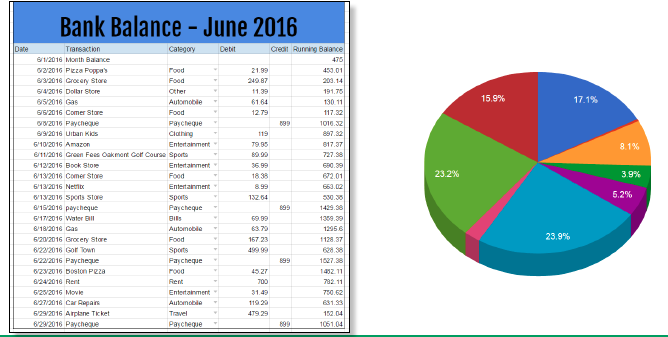
Balance Sheet Lesson
Students learn a practical, real life skill in this lesson. They discover how to create a balance sheet similar to what you would see in a bank statement. Fictional debit and credit transactions are typed in and students create a custom math function to calculate a running bank balance. This lesson also explores some data validation techniques to make data entry more accurate. Specifically, students use a date picker control to ensure that date formats are consistent. Also, they learn to use drop-down lists that contain all the categories of expenses/credits they would use.
Students learn a practical, real life skill in this lesson. They discover how to create a balance sheet similar to what you would see in a bank statement. Fictional debit and credit transactions are typed in and students create a custom math function to calculate a running bank balance. This lesson also explores some data validation techniques to make data entry more accurate. Specifically, students use a date picker control to ensure that date formats are consistent. Also, they learn to use drop-down lists that contain all the categories of expenses/credits they would use.
|
|
Data Trends
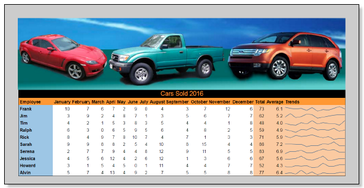
In this lesson, students learn to add in a line graph to represent a trend and also review basic formatting in Google Sheets including changing fonts, colors, etc...
FINAL PROJECT
Bucket List Project
This activity also uses Google Maps and Google Slides. This project will likely take 5-10 class periods to complete.
The premise for the project is simple and realistic. Students play the role of journalists who work for an online magazine. Their editor has given them a $15,000 budget and 30 days. The idea is for them to come up with an idea for a feature article to be in one of the magazines coming editions. Students come up with the idea of a Bucket List adventure. The editor requires the following three documents:
- A budget for the trip constructed in Google Sheets.
- A Google Map which displays the destinations that will be visited on the trip.
- A Google Slides presentation which captures the essence of the journey.
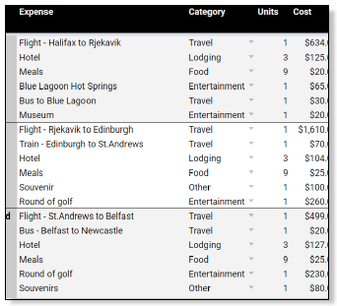
In the Google Sheets budget, students itemize all of the proposed expenses they will incur on the journey. During this stage, students will need to research flight, hotel and event information online. They will use custom math functions to keep a running tally on how much money has been spent and how much is remaining on the budget. Students will be able to see if they are over budget and will need to make adjustments to their plans if necessary. They will also create a pie chart that breaks down how much each category costs.
|
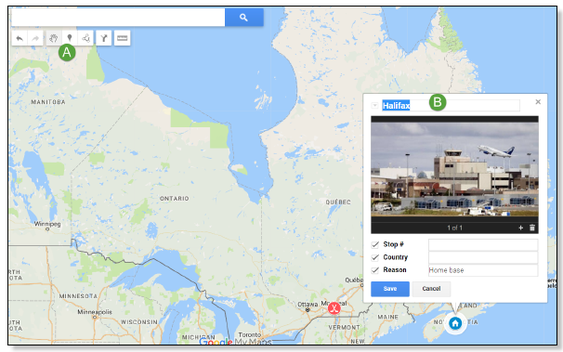
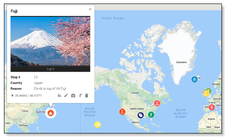
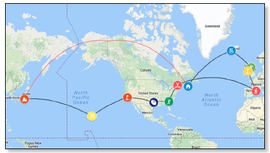
Students will import information from their Google Sheets document into a Google Map. This allows for a big picture look at their proposed travel route. Students customize the map to include pictures and custom icons to mark each stop.
|
|
The last document is a Google Slides presentation. This will be used to "pitch" their Bucket List idea. Students present their slideshows to the rest of class. Also, this project could allow for document sharing and collaboration, or individual work.